DMT6: Visualizing complexity // 15.05.14 @ ENSCI
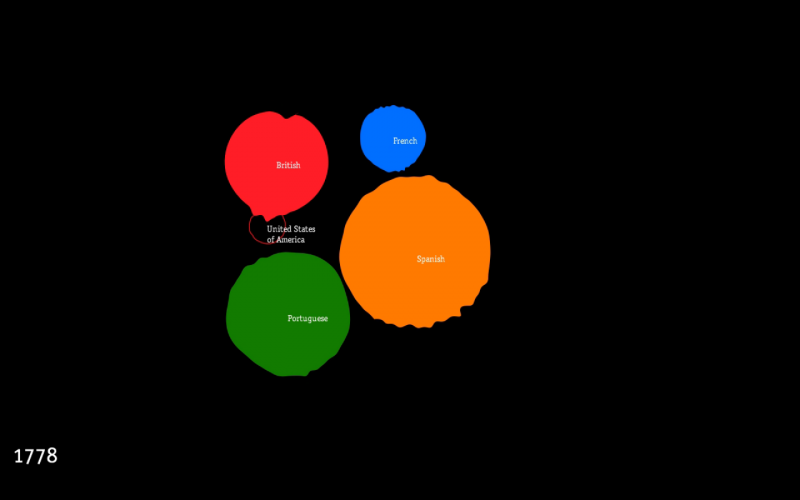
[img: Pedro Miguel Cruz, Empires decline – revisited, 2010] Early data visualizations in science ordered information in tree-like representations to address issues of classification and genealogy. The Encyclopédie’s Systême figuré des connaissances humaines and Darwin’s Tree of life are classical examples of this first period of data visualization. The recent shift towards issues of organized complexity in scientific inquiry (Weaver, 1948) has changed the practice of visualization, marking a transition from trees to networks. Despite a rich stream of research, network visualization still lacks a basic grammar of standardized graphic presentation as that advocated by Willard Brinton (Brinton, 1939) and […]